Market Sessions By Zcointv/ScottfdxThis code has been writted By Zcointv/Scottfdx traders
This is a Market Volatility Box Breakout Strategy designed for intraday trading on 5-minute charts.
How it Works:
Volatility Box: The strategy defines a "volatility box" by capturing the price range (High and Low) around the New York market open.
The box begins one hour before the market open and ends 30 minutes after the market open.
The High and Low of this box are locked for the rest of the day.
Breakout Entry: A trade is opened only after this session period has ended.
Long: A 5-minute candle must close above the High of the box.
Short: A 5-minute candle must close below the Low of the box.
Risk Management:
1% Risk: Each trade risks a maximum of 1% of the total account equity. The position size is calculated dynamically based on this risk.
Stop Loss: The initial stop-loss is placed just outside the opposite side of the box.
1:1 Take Profit: The target is set at a 1:1 risk-to-reward ratio.
Partial Exit & Breakeven: When the take-profit target is hit, 50% of the position is closed. The stop-loss for the remaining 50% is then immediately moved to the entry price (breakeven).
Key Features:
The strategy is limited to one trade per day.
The indicator also has options to display configurable boxes for the Tokyo and London sessions.
The High and Low levels of the volatility box are plotted on the chart for visual reference.
ابحث في النصوص البرمجية عن "the strat"

LANZ Strategy 6.0🔷 LANZ Strategy 6.0 — NY Session Entry Tool & Multi-Account Risk Manager
LANZ Strategy 6.0 - Is a trading tool designed to help traders plan, execute, and manage operations with a focus on risk management, multi-account handling, and visual clarity.
It works exclusively on the 1-hour timeframe ⏳ and is optimized for the New York market opening dynamics.
🧠 Core Concept
The strategy identifies bullish trading opportunities based on the 09:00 NY candle. Once detected, it automatically calculates and draws:
EP (Entry Price) — The exact level where the trade setup triggers.
SL (Stop Loss) — Based on a customizable percentage of the candle's high–low range or wick extremes.
TP (Take Profit) — Calculated using your chosen Risk–Reward Ratio (e.g., 1:5, 1:3, etc.).
⚙️ Main Features
⏳ Time-Specific Execution
Operates only when the 09:00 NY candle closes bullish.
Ideal for traders who align with the New York Session market structure.
💰 Multi-Account Lot Size Management
Up to 5 independent accounts can be configured with their own capital and risk %, showing the exact lot size to use for each.
📏 Adaptive Risk Control
Supports both Forex and non-Forex assets (indices, gold, oil).
For non-Forex, you can manually define the pip value according to your broker’s specs.
🎨 Visual Trade Map
Automatically plots clean and easy-to-read EP, SL, and TP lines with customizable colors, styles, and thickness.
A floating information panel displays levels, pip distances, and lot sizes.
🔔 Real-Time Alerts
Alerts for:
Entry signal detection.
Stop Loss hit.
Take Profit hit.
Manual close at the defined session end.
📊 Example
If you trade GBPUSD with Account #1 set to $10,000 and 2% risk,
and the 09:00 NY candle closes bullish with SL = 30 pips and RR = 5:1:
EP, SL, and TP levels are drawn instantly.
Risk = $200 (2% of $10,000).
Lot size is calculated automatically.
All details are shown in the on-chart panel.
🛠️ How to Use
Load the indicator on a 1-hour chart.
Configure risk settings and account data.
Wait for the 09:00 NY candle to close bullish.
Use the displayed lot size and levels to execute your trade.
Let the tool alert you for SL, TP, or manual close.
⚠️ Disclaimer:
This script is for educational purposes only. It does not guarantee profits and past performance does not represent future results. Always manage your risk responsibly.
👨💻 Credits:
💡 Developed by: LANZ
🧠 Execution Model & Logic Design: LANZ
📅 Designed for: 1H timeframe and NY-based entries

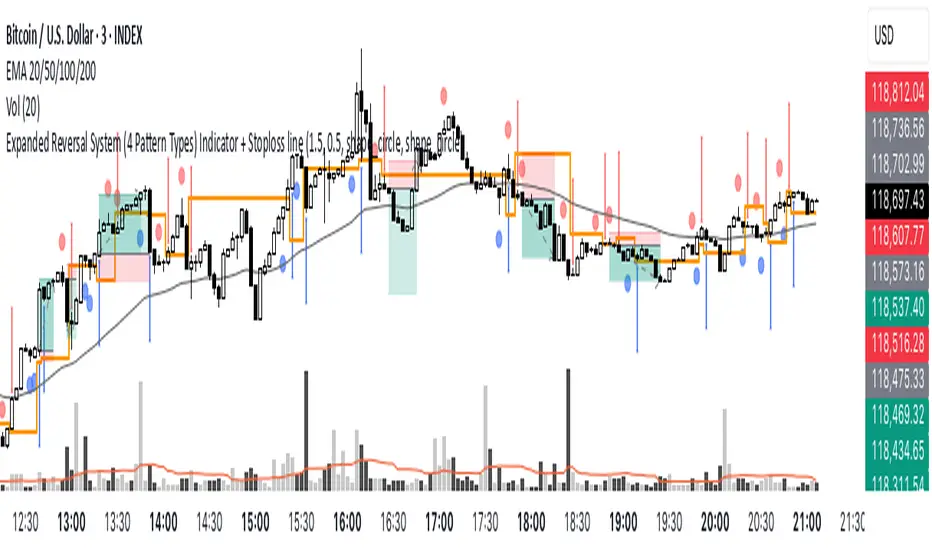
Expanded Reversal System (4 Pattern Types) Indicator + S/LOverview
This is a comprehensive and fully customizable indicator designed to provide clear, reliable, and non-repainting signals for manual traders. Built on a robust 3-bar confirmation logic, this tool aims to eliminate the common errors and visual bugs found in simpler indicators, giving you a professional-grade tool for identifying high-probability reversals.
The indicator not only provides entry signals but also plots the precise Stop Loss level for each setup, taking the guesswork out of your risk management.
How to Trade with This Indicator 🎯
This indicator provides all the necessary information to plan and execute a trade. Here is the step-by-step process:
Step 1: The Setup Circle
First, wait for a Setup Signal (a blue or red circle) to appear on a candle. This is your "heads-up" that a potential trade is forming. This candle is the "Setup Candle."
Step 2: The Trigger Arrow
Next, wait for a Blue BUY Arrow (▲) or a Red SELL Arrow (▼) to appear. This is your confirmation and your signal to prepare to enter.
Step 3: The Entry
You enter the trade at the open of the candle the arrow appears on. This is the "Entry Candle."
Step 4: The Stop Loss
The indicator automatically plots a horizontal orange line on your chart at the same time as the Entry Arrow. This line represents your exact Stop Loss level. It is placed at the low (for buys) or high (for sells) of the candle marked with the Setup Circle.
Step 5: The Take Profit (Risk/Reward)
The Take Profit level must be calculated based on the strategy's Risk/Reward (R:R) ratio.
Step 6: Early invalidation would be a signal in the opposite direction confirmed by an arrow to enter the trade, in that case close the trade and enter in the opposite direction, that's how the strategy has been tested with amazing results.
But if you wish, you could use other confluence for better confirmation, such as volume or bollinger bands.
Exchange assets do not work , you will ned to use the all time index for both the signal indicator and the strategy tester.
Use the trade tool in TV for longs or shorts
Then, apply the appropriate ratio:
Long (Buy) Take Profit (1:6 R:R):
Short (Sell) Take Profit (1:4 R:R):
Fully Customizable Settings 🔧
This indicator gives you full control. In the settings (⚙️ icon), you can:
Individually turn each of the four pattern types (Hammers, Engulfing, Piercing, Dark Cloud) ON or OFF.
Adjust the specific rules for what qualifies as a Pin Bar (Hammer/Shooting Star).
Change the color and shape of all signals (setup shapes, entry arrows, and the stop loss line).
Disclaimer: This is a tool for manual trading and does not constitute financial advice. All trading involves risk, and past performance is not a guarantee of future results. Please use this indicator responsibly as part of a comprehensive trading plan.
Hemant Ka IkkaThis Indicator contains all the strategies of Hemant Jain Swing Trading.
Founder of Revaledge Securities

Alt Coin Season Indicator v2Trend Core Strategy with Alt Season Filter
This script is a comprehensive trend-following strategy designed to identify high-probability long entries for altcoins. It combines a core mean-reversion setup with a powerful, two-layer "Alt Season" filter to ensure trades are only considered when macro conditions are most favorable.
The primary goal is to enter a trade during a short-term dip (oversold RSI) but only when the broader market structure (Halving Cycle and BTC Dominance) confirms that capital is flowing into altcoins.
How It Works: The Logic
The strategy is built on two distinct layers that must align for a signal to be valid.
1. The Core Trading Setup
A potential LONG ENTRY signal is identified when a specific set of trend and momentum conditions are met:
Long-Term Trend: The price must be trading above the 200-period Slow Moving Average.
Mean Reversion Entry: The RSI must be in an oversold state (below 35).
Favorable Dominance: BTC.D must be trending down, and ETH.D must be trending up, indicating a "risk-on" environment.
2. The "Alt Season" Master Filter
This is the master switch that confirms the macro environment. A trade setup is only considered valid if the "Alt Season" filter is active. This filter has two sub-layers:
Bitcoin Halving Cycle: The script tracks the 4-year cycle and only allows signals during the two most bullish phases:
Post-Halving Accumulation (Yellow Background): The period immediately following a halving.
Parabolic Uptrend (Green Background): The primary bull market phase.
Signals are automatically disabled during the "Distribution" (Red) and "Bear Market" (Dark Red) phases.
BTC Dominance State: This defines the precise start and end of an alt season based on capital flows.
START (🚀): Alt Season becomes active when BTC.D crosses below 60%.
RESET (⚠️): The state is temporarily disabled if BTC.D reclaims 60%, acting as a warning signal.
END (🛑): The season is officially over when BTC.D crosses back above 40% from below.
On-Chart Visuals
The script provides a rich visual interface for at-a-glance analysis:
Background Colors: The chart background changes color to reflect the current Halving Cycle phase. A bright cyan overlay indicates when the "Alt Season" filter is fully active.
Dynamic Shapes:
🚀 (Rocket): Signals the start of a confirmed Alt Season. The size is dynamic—a larger rocket appears if the RSI is more deeply oversold, indicating a higher-conviction setup.
⚠️ (Warning Sign): Appears if BTC.D reclaims the 60% start level, indicating a temporary pause or "reset" of the alt season.
🛑 (Stop Sign): Marks the official end of the Alt Season.
On-Screen Table: A real-time dashboard in the top-right corner shows the status of every single condition, providing full transparency into the script's logic.
How to Use
Wait for the "Alt Season Active" (cyan) background to appear. This is your primary confirmation that macro conditions are favorable.
Look for LONG ENTRY labels. These appear when the core trading setup aligns with an active Alt Season.
Use the on-screen table to understand why a signal is or is not firing.
Set Alerts: The script includes three distinct alerts for "Alt Season Activated," "Alt Season Warning," and "Alt Season Officially Over" to keep you updated on the macro environment.
Disclaimer: This tool is for educational purposes only and should not be considered financial advice. All trading involves risk. Always conduct your own research and backtesting before making any trading decisions.

VHX EMA 135/315📈 EMA 135/315 Cross Strategy – Your Trend Compass with Smart Confirmations
🔍 Core Idea
The EMA 135/315 Cross strategy is a trend-following system.
It tracks two moving averages:
EMA 135 → the “fast” line that reacts to short-term price moves
EMA 315 → the “slow” line that reacts to the bigger trend
When the fast EMA crosses above the slow EMA → market momentum is turning up → BUY signal 🟢
When the fast EMA crosses below the slow EMA → momentum is turning down → SELL signal 🔴
This gives you a clear entry trigger — no guessing, no overcomplication.
✨ On Your Chart
BUY/SELL Arrows
🟢 Green arrow = bullish cross → trend turning up
🔴 Red arrow = bearish cross → trend turning down
Trend Info Panel (Top Left)
Current Trend: BUY / SELL / Neutral
Last Cross: how many bars ago it happened
EMA Gap in %: measures the strength of the trend
Status: “Approaching” if EMAs are getting close → possible cross soon
Automatic TP/SL Levels
📈 TP line (+2% from entry)
📉 SL line (–0.5% from entry)
Saves time — you instantly see your target and protection
EMA Distance Meter
Big % gap = strong trend momentum 🚀
Small % gap = weak or sideways market ⚠️
Real-Time Alerts
You get notified when a cross happens, even if you’re away from the screen
🧠 The Logic Behind It
The EMA 135 reacts faster → it reflects short-term momentum
The EMA 315 moves slower → it reflects the main trend
When the fast EMA overtakes the slow EMA: short-term strength now aligns with the long-term trend → higher probability of a sustained move
The gap % tells you how strong the alignment is — large gap = cleaner moves, small gap = market in transition
“Approaching” status warns that the EMAs are converging, which often happens before a reversal
📊 Boosting the Strategy with Volume Analysis
The EMA cross is a strong trigger, but volume confirms the quality of the move:
High Volume + Cross → more reliable signal, as strong market participation is pushing the trend
Low Volume + Cross → caution, the move might be weak or a false breakout
💡 Tip:
Check the volume histogram or a volume-based indicator (e.g., Volume Profile, OBV).
On a BUY signal: volume should spike above the recent average.
On a SELL signal: watch for strong selling volume bars.
📍 Adding Support & Resistance for Precision
Support and resistance levels help filter out bad trades and optimize entries:
Best BUY setups:
EMA 135 crosses above EMA 315 near a known support zone
Bonus if volume confirms the move
Avoid buying directly into a strong resistance
Best SELL setups:
EMA 135 crosses below EMA 315 near a known resistance zone
Bonus if selling volume is strong
Avoid selling directly into a major support
💡 Use tools like horizontal lines, previous highs/lows, and Volume Profile nodes to spot these zones.
📈 Best Usage Practices
Timeframes
Lower timeframes (1m–5m) → more signals, but more noise → best for scalping with extra filters
Always Combine With Confirmation
EMA Cross = Trigger
Volume spike = Confirmation
S/R zone in your favor = High-probability setup
Manage Risk
Start with the built-in TP/SL
Adjust SL if volatility is higher than usual
Consider trailing stop once price moves in your favor
Avoid Sideways Markets
If EMA gap % is very small and crosses happen often → stand aside until a clear direction forms
Use Alerts
Set alerts for BUY & SELL crosses so you never miss a setup
In short:
This isn’t just an EMA cross indicator — it’s a trend system with built-in risk management, strength measurement, and pre-trade preparation. Combine it with volume confirmation and smart use of support/resistance, and you turn a simple signal into a high-probability trading edge.

The Golden TriggerThe Golden Trigger - XAUUSD
Unlock your trading potential with The Golden Trigger, a powerful technical analysis strategy designed for XAUUSD. This custom indicator combines the synergy of moving averages and the MACD to provide clear buy and sell signals, optimizing your trading decisions.
Key Features:
SMA Crossovers: Utilizes the 2-period and 7-period Simple Moving Averages (SMAs) to spot short-term price momentum shifts, triggering buy or sell signals.
MACD Confirmation: The strategy only acts when the MACD aligns with the price action, ensuring you’re trading with the market's momentum.
Long-Term Trend Filter: The 200-period SMA ensures that your trades align with the overall market trend, helping you avoid counter-trend moves.
Real-Time Alerts: Get notified when it's time to act with the built-in alert conditions for both Buy and Sell signals.
Customizable and User-Friendly: Tailor the strategy to your preferences and trade with confidence.
This indicator is perfect for traders looking to catch short-term trends in gold (XAUUSD), with clear visual buy and sell markers that appear directly on the chart.
Why You Need This Indicator:
Stay ahead of the market with real-time signals
Filter trades to match the prevailing market trend
Enhance your trading strategy with a clear, simple-to-follow system
Unlock the power of The Golden Trigger today and make smarter, more confident trades!

OMU_CJ CombinedThis script is a custom technical analysis tool designed for TradingView, built on Pine Script v6.
It combines multiple indicators and logic to provide clear buy and sell signals, optimized for intraday and swing trading.
The strategy includes dynamic trend detection, volatility filters, and adjustable parameters for better adaptability to different market conditions.
Traders can use it to identify potential entry and exit points with improved accuracy.
Key Features:
Multi-indicator signal confirmation
Adjustable settings for different timeframes
Visual buy/sell markers on the chart
Works on all major asset classes (stocks, crypto, forex, indices)
Optimized for both short-term and long-term trading strategies
Disclaimer:
This script is for educational purposes only and should not be considered as financial advice. Always do your own research before trading.

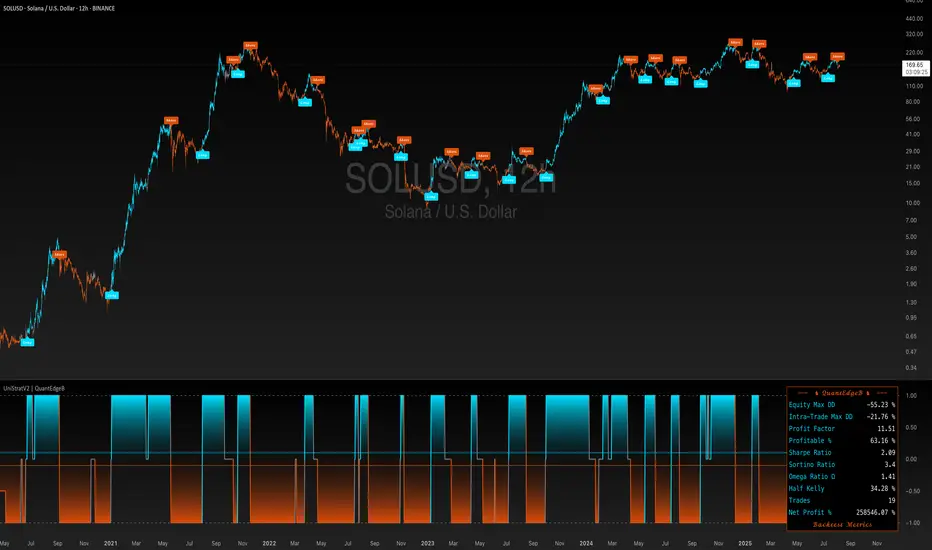
UniStratV2 | QuantEdgeBUniversal Strategy V2 | QuantEdgeB
🔍 What is the Universal Strategy?
A dynamic, multi-engine trading framework engineered to adapt across asset classes, timeframes, and market conditions. It fuses multiple complementary signal engines into a single, unified decision model—automatically balancing speed, smoothness, momentum scoring, and breakout precision.
⚙️ Core Characteristics
• Multi-Engine Logic: Combines fast-reacting trend detection, adaptive smoothing, statistical momentum scoring, and volatility-normalized breakout confirmation.
• Modular Architecture: Each engine operates independently yet contributes to a unified signal index—allowing plug-and-play customization or replacement of individual components.
• Adaptive Thresholds: Dynamically adjusts trigger levels based on market volatility, percentile bands, or standard-deviation filters, ensuring robust performance in both quiet and turbulent conditions.
• Unified Signal Aggregation: Individual engine outputs (bullish/bearish) are averaged into a single trend, minimizing noise and reinforcing conviction.
💡 Key Benefits
• Balance of Reactivity & Reliability: Fast-acting modules catch early trend shifts, while smoother, statistical layers confirm and filter false moves.
• Versatility Across Markets: Designed to work equally well in trending, range-bound, or high-volatility environments, and across equities, FX, commodities, and crypto.
• Customizable & Extensible: Users can tailor the number and type of engines, threshold methodologies, and signal-aggregation rules to match their style and risk tolerance.
• Transparency & Confidence: A real-time signal dashboard shows each engine’s contribution and the overall strategy, offering clear insight into what drives the strategy’s decisions.
📊 Generic Use Cases
1. Trend Capture
Identify and ride sustained directional moves with early-warning and confirmation engines.
2. Breakout Trading
Detect and validate volatility expansions while filtering out whipsaws.
3. Momentum Assessment
Quantify the strength behind price moves to distinguish fleeting spikes from genuine trends.
4. Cross-Asset Rotation
Apply the same framework to multiple symbols—allocating capital to the strongest opportunities.
📌 In Summary
The Universal Strategy V2 | QuantEdgeB is a framework, not a single indicator. By orchestrating diverse, forward-tested methodologies into one cohesive engine, it delivers adaptive precision, signal clarity, and robust performance—empowering traders to navigate any market environment with data-driven confidence.
🔹 Disclaimer: Past performance is not indicative of future results. Always backtest and align any strategy with your objectives and risk tolerance before live trading.
BTC 5M Scalper: 3EMA Reversal v1.6 Lite by AIOBest Timeframe: 5 minutes!!
Optimal Asset: BTC/USDT (Bitcoin)
Stop Placement: Below the signal candle's low (for long) / Above the signal candle's high (for short)
Risk/Reward: Minimum 1:2 ratio recommended
Description:
This 3EMA Reversal strategy identifies trend continuation signals using:
Fast EMA (20) and Slow EMA (50) crossover
Volume confirmation (above 20-period average)
Engulfing candle pattern
Built-in stop loss and take profit levels
Usage Instructions:
Apply to BTC/USDT 5-minute chart
Enter long when green triangle appears (stop below signal candle)
Enter short when red triangle appears (stop above signal candle)
TP levels are automatically calculated based on your RR setting
Pro Tip: Combine with 1-hour trend analysis for better results. The strategy works best in trending markets with above-average volume.

KSK EMA StrategyStrategy Overview
This is a trend-following strategy that uses two Exponential Moving Averages (EMAs) to identify trading opportunities in the market. The strategy generates buy and sell signals based on the relationship between price and the EMA lines.
How It Works
Entry Signals
ENTRY CALL (Green): Generated when the complete candle closes above the EMA 9 (candle low > EMA 9)
ENTRY PUT (Red): Generated when the complete candle closes below the EMA 9 (candle high < EMA 9)
Exit Signals
EXIT CALL (Gray): Triggered when price closes below the EMA 21 (candle high < EMA 21)
EXIT PUT (Gray): Triggered when price closes above the EMA 21 (candle low > EMA 21)
Visual Components
Red Line (Thickness 3): EMA 9 - Short-term trend indicator
Green Line (Thickness 3): EMA 21 - Medium-term trend indicator
Green Triangles: Buy entry signals
Red Triangles: Sell entry signals
Gray X Marks: Exit signals
Background Coloring:
Light green: Currently in a long position
Light red: Currently in a short position
Strategy Logic
Buy Signal: When price shows strength by closing completely above the EMA 9
Sell Signal: When price shows weakness by closing completely below the EMA 9
Exit Long: When price weakness pulls back below EMA 21
Exit Short: When price strength pushes back above EMA 21
Key Features
Trend Following: Captures momentum in the direction of the trend
Dual EMA System: Uses faster EMA (9) for entries and slower EMA (21) for exits
Complete Candle Confirmation: Only triggers signals after full candle confirmation
Position Management: Maintains only one position at a time (no simultaneous long/short)
Visual Clarity: Clear labels and color coding for easy interpretation
Best Usage Conditions
Trending Markets: Works best in markets with clear directional bias
Moderate to High Volatility: Provides better signal quality in active markets
Multiple Timeframes: Can be used on any timeframe (15min, 1H, 4H, Daily recommended)
Risk Management Notes
The strategy uses the EMA 21 as a dynamic stop-loss level
Position sizing and additional risk management should be implemented separately
Past performance does not guarantee future results
Customization
You can adjust the EMA periods in the indicator settings to suit your trading style:
Shorter periods: More sensitive, more signals (higher frequency)
Longer periods: Less sensitive, fewer but potentially higher quality signals

Opening Range Box with Breakout LabelsOverview
This strategy automates the classic Opening Range breakout trading technique by identifying the price range during a specified initial time window (the "Opening Range") each trading day, and then triggers trades when the price breaks out above or below this range. It draws a visual box around the opening range for clarity and provides breakout signals with configurable take profit and stop loss levels expressed in pips.
Key Features
Configurable Opening Range Time Window:
Define the start and end time of the opening range session using hour and minute inputs (24-hour format). For example, you can set it to capture the first 15 minutes after market open.
Extended Box Display:
Optionally extend the opening range box display by a configurable number of hours beyond the initial range period for ongoing visual reference.
Opening Range Box Visualization:
A semi-transparent colored box is drawn on the chart representing the high and low price of the opening range period, updating dynamically as the session progresses.
Breakout Detection & Entry Signals:
The strategy detects breakouts once the opening range session ends (including the extended period). It places:
A long entry when the price closes above the opening range high.
A short entry when the price closes below the opening range low.
Take Profit and Stop Loss in Pips:
You can define your desired take profit and stop loss levels in pips, allowing consistent risk management tailored to the instrument's pip value.
Visual Breakout Labels:
Up and down arrow labels appear on the chart at breakout points to clearly mark trade signals.
Max Breakout Labels Limit:
Limits the number of breakout labels displayed on the chart to avoid clutter.

Inside Bar Breakout with TP/SL - ModifiedInside Bar Breakout Trade Plan
Strategy Overview
This plan utilizes the Inside Bar Breakout indicator to identify high-probability breakout trades. The strategy capitalizes on consolidation patterns (inside bars) followed by breakouts from mother bars, with predefined risk management.

EURUSD Kill Zone [Plazo Sullivan Roche Capital]EUR/USD Kil Zone
Core Logic: Navigating the New‑York Kill‑Zone
The EUR/USD Killzone is designed to exploit repeatable patterns that occur during the overlap of the London and New‑York trading sessions. Research shows that the New‑York “kill zone”—roughly 07:00–09:00 EST—produces the most dramatic moves in EUR‑ and USD‑linked currency pairs
During this window, large institutions often sweep out liquidity resting above or below the Asian and early‑London session extremes , triggering sharp reversals before a new intraday trend emerges. This is in contrast to the single pre-market sweeps occuring for GOLD/
This modeul uses ICT/Smart Money Concepts to read these patterns and waits for three confirmations before signalling a trade:
Liquidity Sweep & Rejection. Price must spike beyond the combined Asian and early‑London range and then reject that area (a sharp wick and opposite‑coloured candle), signalling that stops have been cleared. The module defines the Asian range from 00:00–05:00 EST and the London range from 02:00–05:00 EST, following the guideline that overlapping sessions produce the greatest volatility
Market Structure Break. It then waits for the 5‑minute price to close beyond the most recent swing high/low (pivot), confirming that a genuine shift in order flow has occurred rather than a simple stop‑run.
Fair‑Value‑Gap (FVG) Re‑Test. Upon the break, the script records the high and low of that 5‑minute “displacement” candle and defines a fair‑value gap—the imbalance between buyers and sellers. Rather than entering immediately, it sets a virtual limit order at the 50 % level of this gap. A trade is only triggered once price retraces to this mid‑point, providing a high‑probability, high‑reward entry.
These three filters help avoid common pitfalls when trading kill zones, such as false breakouts and news‑driven whipsaws. The indicator also monitors higher‑timeframe bias (4‑hour and daily charts) using 50‑ and 200‑period moving averages to gauge whether the intraday signal aligns with the broader trend.
Feature Set
The indicator provides a suite of visual and analytical tools to support disciplined trading:
Session Range Mapping: automatically draws the Asian (00:00–05:00 EST) and London (02:00–05:00 EST) session highs and lows, making it easy to see when price sweeps these levels.
Kill‑Zone Monitoring: a built‑in timer isolates the 07:30–09:00 EST window and limits the indicator to one trade per session to avoid over‑trading.
Pivot‑Break Detection: uses 5‑minute swing highs/lows to confirm that order flow has shifted before looking for entries.
Fair‑Value‑Gap Re‑test: defines an FVG from the displacement candle and waits for a 50 % retrace before triggering a signal. This improves risk‑to‑reward by entering at a discount (for longs) or premium (for shorts).
Higher‑Timeframe Dashboard: displays bullish/bearish/neutral biases on the 4‑hour and daily charts, plus a confidence rating (0–2) indicating how many of these timeframes agree with the signal direction.
Alerts: optional alerts can be configured for buy‑only, sell‑only or either‑direction signals.
Best Practices for Use
Align with Major Volatility Windows. The indicator is most effective during the New‑York kill zone. Avoid trading outside this window, and be aware of high‑impact news (e.g., FOMC announcements) that can distort price action
Check Higher‑Timeframe Bias. Use the dashboard to ensure the intraday signal aligns with the 4‑hour and daily trends. For instance, a long signal that aligns with a bullish daily bias carries higher conviction than one going against it.
Manage Risk Responsibly. Even with multiple filters, no strategy is foolproof. Use stop‑loss orders just beyond the liquidity sweep and size positions appropriately.
Combine with Fundamental Awareness. Check your economic calendar for European and U.S. data releases. If an important release occurs during the kill zone, consider standing aside or reducing risk.
Back‑test and Forward‑Test. Always validate the strategy across different market conditions and broker feeds. Pay attention to how spreads, volatility and news events influence the indicator.
Use as Part of a Toolkit. Consider combining the indicator with other confirmation tools such as momentum oscillators, volume analysis or price‑action patterns to refine entries further. Smart‑Money Concepts often use confluence, not a single signal.
What's in It for You?
The EUR/USD Liquidity Sweep Indicator distils institutional concepts—liquidity hunts, market‑structure shifts and fair‑value gaps—into an intuitive, automated tool. By waiting for a retrace into the displacement candle’s imbalance, it helps capture trades where risk‑to‑reward is skewed strongly in your favour. The dashboard encourages you to trade with the higher‑timeframe trend, and built‑in alerts ensure you never miss an opportunity.
In volatile kill‑zone environments, discipline and patience are vital. This indicator enforces both: it tracks session ranges, confirms structure, waits for a retrace, and triggers only when multiple conditions align. Coupled with sound risk management and your own judgement, it can become a cornerstone of a high‑probability trading plan.
Always remember that markets evolve. Continue to refine the indicator and your strategy as you gather more experience and data. The learning journey never ends, but this tool is designed to accelerate it.

9:45am NIFTY TRADINGTime Frame: 15 Minutes | Reference Candle Time: 9:45 AM IST | Valid Trading Window: 3 Hours
📌 Introduction
This document outlines a structured trading strategy for NIFTY & BANKNIFTY Options based on a 15-minute timeframe with a 9:45 AM IST reference candle. The strategy incorporates technical indicators, probability analysis, and strict trading rules to optimize entries and exits.
📊 Core Features
1. Reference Time Trading System
9:45 AM IST Candle acts as the reference for the day.
All signals (Buy/Sell/Reversal) are generated based on price action relative to this candle.
The valid trading window is 3 hours after the reference candle.
2. Signal Generation Logic
Signal Condition
Buy (B) Price breaks above reference candle high with confirmation
Sell (S) Price breaks below reference candle low with confirmation
Reversal (R) Early trend reversal signal (requires strict confirmation)
3. Probability Analysis System
The strategy calculates Win Probability (%) using 4 components:
Component Weight Calculation
Body Win Probability 30% Based on candle body strength (body % of total range)
Volume Win Probability 30% Current volume vs. average volume strength
Trend Win Probability 40% EMA crossover + RSI momentum alignment
Composite Probability - Weighted average of all 3 components
Probability Color Coding:
🟢 Green (High Probability): ≥70%
🟠 Orange (Medium Probability): 50-69%
🔴 Red (Low Probability): <50%
4. Timeframe Enforcement
Strictly 15-minute charts only (no other timeframes allowed).
System auto-disables signals if the wrong timeframe is selected.
📈 Technical Analysis Components
1. EMA System (Trend Analysis)
Short EMA (9) – Fast trend indicator
Middle EMA (20) – Intermediate trend
Long EMA (50) – Long-term trend confirmation
Rules:
Buy Signal: Price > 9 EMA > 20 EMA > 50 EMA (Bullish trend)
Sell Signal: Price < 9 EMA < 20 EMA < 50 EMA (Bearish trend)
2. Multi-Timeframe RSI (Momentum)
5M, 15M, 1H, 4H, Daily RSI values are compared for divergence/confluence.
Overbought (≥70) / Oversold (≤30) conditions help in reversal signals.
3. Volume Analysis
Volume Strength (%) = (Current Volume / Avg. Volume) × 100
Strong Volume (>120% Avg.) confirms breakout/breakdown.
4. Body Percentage (Candle Strength)
Body % = (Close - Open) / (High - Low) × 100
Strong Bullish Candle: Body > 60%
Strong Bearish Candle: Body < 40%
📊 Visual Elements
1. Information Tables
Reference Data Table (9:45 AM Candle High/Low/Close)
RSI Values Table (5M, 15M, 1H, 4H, Daily)
Signal Legend (Buy/Sell/Reversal indicators)
2. Chart Overlays
Reference Lines (9:45 AM High & Low)
EMA Lines (9, 20, 50)
Signal Labels (B, S, R)
3. Color Coding
High Probability (Green)
Medium Probability (Orange)
Low Probability (Red)
⚠️ Important Usage Guidelines
✅ Best Practices:
Trade only within the 3-hour window (9:45 AM - 12:45 PM IST).
Wait for confirmation (closing above/below reference candle).
Use probability score to filter high-confidence trades.
❌ Avoid:
Trading outside the 15-minute timeframe.
Ignoring volume & RSI divergence.
Overtrading – Stick to 1-2 high-probability setups per day.
🎯 Conclusion
This NIFTY Trading Strategy is optimized for 15-minute charts with a 9:45 AM IST reference candle. It combines EMA trends, RSI momentum, volume analysis, and probability scoring to generate high-confidence signals.
🚀 Key Takeaways:
✔ Reference candle defines the day’s bias.
✔ Probability system filters best trades.
✔ Strict 15M timeframe ensures consistency.
Happy Trading! 📈💰

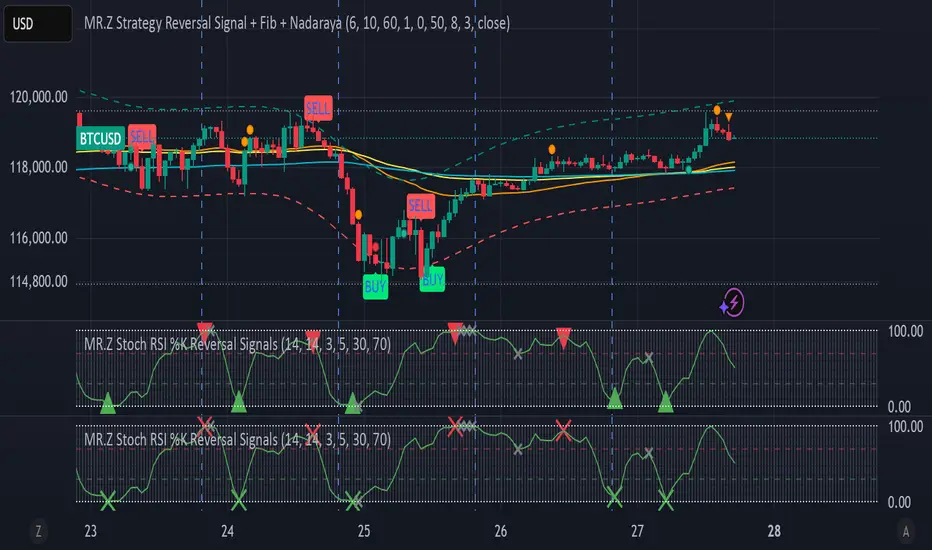
MR.Z Stoch RSI %K Reversal Signals🟢 K Strategy Description
The K Strategy is a momentum-based trading technique using the %K line from the Stochastic Oscillator. It is designed to detect potential reversal points in price trends by identifying extreme conditions of overbought and oversold levels.
✅ Core Logic:
The strategy monitors the %K line (a smoothed form of RSI momentum).
A Buy Signal is triggered when:
The %K line dips to or below a defined lower threshold (commonly 30 or less).
This suggests the asset is oversold and may soon reverse upward.
A Sell Signal is triggered when:
The %K line peaks above an upper threshold (commonly 70 or more).
This suggests the asset is overbought and may reverse downward.
⚙️ Adjustable Parameters:
K Length: The sensitivity of the %K calculation (affects how fast it responds).
Buy Level: Set your oversold trigger (e.g., 20–40).
Sell Level: Set your overbought trigger (e.g., 60–100).
Signal Smoothing (optional): Helps reduce noise and avoid false triggers.
📈 Use Case:
This strategy is effective in ranging markets where prices frequently oscillate. It can also be used with other indicators (like EMA, volume filters, or price action confirmation) to increase accuracy in trending conditions.
Clarix 5m Scalping Breakout StrategyPurpose
A 5-minute scalping breakout strategy designed to capture fast 3-5 pip moves, using premium/discount zone filters and market bias conditions.
How It Works
The script monitors price action in 5-minute intervals, forming a 15-minute high and low range by tracking the highs and lows of the first 3 consecutive 5-minute candles starting from a custom time. In the next 3 candles, it waits for a breakout above the 15m high or below the 15m low while confirming market bias using custom equilibrium zones.
Buy signals trigger when price breaks the 15m high while in a discount zone
Sell signals trigger when price breaks the 15m low while in a premium zone
The strategy simulates trades with fixed 3-5 pip take profit and stop loss values (configurable). All trades are recorded in a backtest table with live trade results and an automatically updated win rate.
Features
Designed exclusively for the 5-minute timeframe
Custom 15-minute high/low breakout logic
Premium, Discount, and Equilibrium zone display
Built-in backtest tracker with live trade results, statistics, and win rate
Customizable start time, take profit, and stop loss settings
Real-time alerts on breakout signals
Visual markers for trade entries and failed trades
Consistent win rate exceeding 90–95% on average when following market conditions
Usage Tips
Use strictly on 5-minute charts for accurate signal performance. Avoid during high-impact news releases.
Important: Once a trade is opened, manually set your take profit at +3 to +5 pips immediately to secure the move, as these quick scalps often hit the target within a single candle. This prevents missed exits during rapid price action.

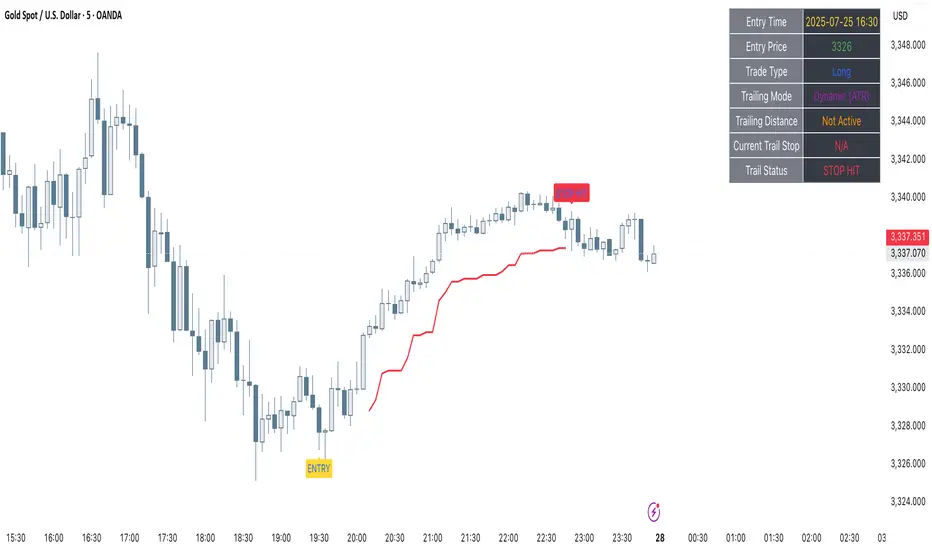
Clarix Trailing MasterClarix Trailing Master
Advanced Manual Entry Trailing Stop Strategy
Purpose :
Clarix Trailing Master is designed to give traders precise control over trade exits with a customizable trailing stop system. It combines manual entry inputs with dynamic and static trailing stop options, empowering users to protect profits while minimizing premature stop-outs.
How It Works:
You manually input your trade entry price and specify the trade direction (Long or Short).
The strategy activates the trailing stop only after the price moves favorably by a configurable profit threshold. This helps avoid early stop losses during initial market noise.
You can choose between a dynamic trailing stop based on Average True Range (ATR) or a fixed static trailing distance. The ATR can also be computed on a higher timeframe for enhanced stability.
Once active, the trailing stop updates live with price movements, ensuring your gains are locked in progressively.
If the price crosses the trailing stop, a clear alert triggers, and the stop-hit status displays visually on the chart.
Key Features:
Manual entry with exact price and timestamp input for precise trade tracking.
Supports both Long and Short trades.
Choice between dynamic ATR-based trailing or static trailing stops.
Configurable profit threshold before trailing stop activation to avoid early exits.
Visual markers for entry and stop-hit points (yellow and red respectively).
Live dashboard displaying entry details, trade status, trailing mode, and current stop level.
Works on all asset classes and timeframes, adaptable to various trading styles.
Built-in audio alert notifies you immediately when the trailing stop is hit.
Usage Tips:
Adjust the profit threshold and ATR settings based on your asset’s volatility and timeframe. For example, use higher ATR multipliers for more volatile markets like crypto.
Consider using higher timeframe ATR values for smoother trailing stops in fast-moving markets.
Ideal for swing trading or position trading where precise stop management is crucial.
Always backtest and paper trade before applying to live markets.
RS Alpha α | viResearchRS Alpha α | viResearch
Conceptual Foundation and Strategy Innovation
RS Alpha α is a dynamic, multi-asset crypto allocation engine designed for precision rotation among trending major assets. Grounded in intra-asset relative strength and enhanced by real-time trend classification, this model moves beyond static filters—adapting allocations to prevailing momentum and volatility regimes.
The strategy is purpose-built to extract tactical alpha in high-beta environments while minimizing whipsaw and drawdowns during uncertain conditions. It achieves this via a systematic, multi-layer filter stack: statistical ranking, trend validation, and risk-adjusted performance scoring.
Technical Architecture and Signal Composition
Relative Strength Matrix:
Assets are scored using a comprehensive 7x7 ratio matrix comparing each asset’s relative momentum against all others. Each row contributes to a cumulative trend score, identifying the top-performing names based on cross-asset strength.
Trend Filters (Multi-Timeframe Adaptive):
Each candidate must pass intra-trend classification (12H, 8H, 4H) and optionally a macro trend regime filter using a user-defined market benchmark (e.g., BTC or ETH on 1D).
Beta & Alpha Filter:
Assets are further screened using custom beta and alpha calculations versus a benchmark. When enabled, only assets showing above-median beta and alpha values are retained.
Optional Risk Ratios:
Sharpe, Sortino, and Omega ratio filters are included (opt-in) for forward testing purposes. These risk metrics refine selection in volatile regimes but are not required for core functionality.
Equity Engine & Allocation Logic:
A real-time system equity curve grows based on rate of change (ROC) from allocated assets, with support for:
100% single asset allocation
50/50 equal split if scores match closely
80/20 weighted allocation based on dominance
Performance Tracking and Alerts
System Equity Visualization: Real-time equity plotted using dynamic coloring tied to the primary asset allocation.
Drawdown Table: Tracks max equity drawdown since a user-defined start date.
Dominant Asset Panel: Displays current allocation format (100%, 80/20, or 50/50) and scoreboard of all considered assets.
Allocation Alerts: Sends alerts when asset rotation occurs, with clear breakdowns of new weightings and symbol changes.
Timeframe Guard: Warns users if running on anything other than the recommended 1D timeframe.
Customization and UX Enhancements
Asset Inclusion Toggle: Easily exclude assets from rotation by changing their input to "USDT".
Background Overlay (Optional): Background color highlights the dominant asset dynamically, with adjustable transparency.
User Switches for All Visual Modules: Toggle individual elements such as alerts, drawdown, dominant tables, or error messages.
Use Case and Target Audience
This tool is ideal for:
Active crypto portfolio managers seeking structured, rule-based asset rotation
Tactical traders who value adaptability and clarity in allocation shifts
Swing traders operating within medium to high-beta environments
It thrives particularly during bull trends, sector rotations, or when paired with macro regime filters like market confidence signals.
Summary
RS Alpha α provides a comprehensive, data-driven framework for crypto asset rotation. It combines statistical rigor with real-time responsiveness, offering high customization and strong risk awareness. Designed for professionals and advanced retail traders alike, it’s both a decision-support tool and a visual performance dashboard.
⚠️ Always validate any strategy with proper backtesting and forward tracking. While RS Alpha α provides robust signal logic, it is one component in a larger portfolio and risk management process.

50/100 EMA Crossover with Candle Confirmation📘 **50/100 EMA Crossover with Candle Confirmation – Strategy Description**
The **50/100 EMA Crossover with Candle Confirmation** is a trend-following strategy designed to filter high-probability entries by combining exponential moving average (EMA) crossovers with strong price action confirmation. This strategy aims to reduce false signals commonly associated with EMA-only systems by requiring a **candle close confirmation in the direction of the trend**, making it more reliable for intraday or swing trading across Forex, crypto, and stock markets.
---
### 🔍 **Core Logic**
* The strategy is based on the interaction of the **50 EMA** (fast-moving average) and the **100 EMA** (slow-moving average).
* **Trend direction** is determined by the crossover:
* **Bullish Trend**: When the 50 EMA crosses **above** the 100 EMA.
* **Bearish Trend**: When the 50 EMA crosses **below** the 100 EMA.
* To **filter out false breakouts**, a **candle confirmation** is used:
* For a **Buy signal**: After a bullish crossover, wait for a strong bullish candle (e.g., full-body green candle) to **close above both EMAs**.
* For a **Sell signal**: After a bearish crossover, wait for a strong bearish candle to **close below both EMAs**.
---
### ✅ **Entry Conditions**
**Buy Entry:**
* 50 EMA crosses above 100 EMA.
* Latest candle closes **above both EMAs**.
* Candle must be bullish (green/full body preferred).
**Sell Entry:**
* 50 EMA crosses below 100 EMA.
* Latest candle closes **below both EMAs**.
* Candle must be bearish (red/full body preferred).
---
### 🛑 **Exit or Take-Profit Options**
* **Fixed TP/SL**: 1:2 or 1:3 risk-reward.
* **Trailing Stop**: Based on recent swing highs/lows or ATR.
* **EMA Exit**: Exit trade when the candle closes on the opposite side of 50 EMA.
---
### ⚙️ **Best Settings**
* **Timeframes**: 5M, 15M, 1H, 4H (works well on most).
* **Markets**: Forex, Crypto (e.g., BTC/ETH), Indices (e.g., NASDAQ, NIFTY50).
* **Recommended filters**:
* Use with RSI divergence or volume confirmation.
* Avoid using during high-impact news (especially on lower timeframes).
---
### 🧠 **Why This Works**
The 50/100 EMA crossover provides a **medium-term trend signal**, reducing noise seen in fast EMAs (like 9 or 21). The candle confirmation adds a **momentum filter**, ensuring price supports the directional bias. This makes it suitable for traders who want a balance of trend and entry precision without overcomplicating with too many indicators.
---
### 📈 **Advantages**
* Simple yet effective for identifying trends.
* Filters out fakeouts using candle confirmation.
* Easy to automate in Pine Script or other trading bots.
* Can be combined with support/resistance or SMC zones for better confluence.
---
### ⚠️ **Limitations**
* May lag slightly in ranging markets.
* Late entries possible due to confirmation candle.
* Works best with additional volume or volatility filter.

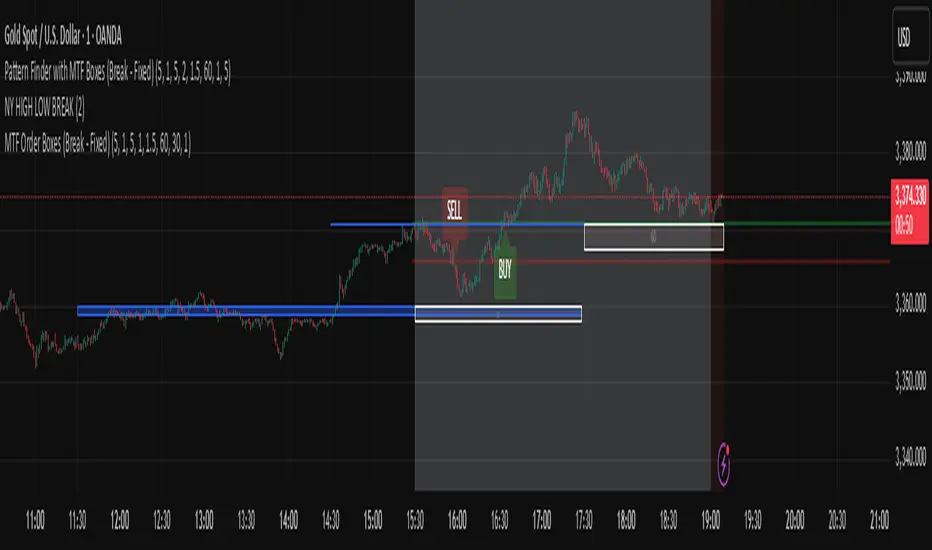
Pattern Finder with MTF Boxes (Break - Fixed)Script Title:
MTF Supply/Demand Zone Indicator with Candlestick Pattern Confirmation
Short Description:
This advanced strategy identifies key Supply and Demand zones (Order Blocks) on higher timeframes (30m & 1h) and then waits for a pullback to these zones on the current timeframe. The final entry signal is triggered upon the appearance of a valid candlestick pattern (e.g., Hammer, Engulfing) within these zones.
Full Description:
Introduction & Core Concept
This script is a powerful trading tool based on a combination of the following concepts:
Multi-Timeframe (MTF) Analysis: Identifying significant structures on higher timeframes to understand the bigger market picture.
Supply and Demand Zones: Finding areas where an imbalance between buyers and sellers has caused strong price movements.
Candlestick Patterns: Using classic candlestick patterns as the final confirmation for entering a trade at these key zones.
The main idea is to avoid trading blindly and instead wait for the price to react to a significant zone, then enter with a confirmation signal.
How the Strategy Works (Step-by-Step)
Identifying the Key Pattern on Higher Timeframes:
The script continuously monitors the 30-minute and 1-hour charts to find a specific pattern: a short consolidation period (usually 1-4 candles) immediately followed by a breakout with a powerful, high-momentum candle (Long Bar). This pattern indicates the formation of a fresh Supply or Demand Zone.
Drawing the Supply and Demand Boxes:
Green Box (Demand Zone): When a minor high is broken by a bullish Long Bar, this area is identified as potential support and marked with a green box.
Red Box (Supply Zone): When a minor low is broken by a bearish Long Bar, this area is identified as potential resistance and marked with a red box.
White Box (Long Bar / Trigger Zone): This box highlights the range of the Long Bar candle itself. A break of or return to this zone provides important signals.
Waiting for a Pullback:
After a zone is identified and drawn, the strategy waits for the price on your current chart to pull back into this box.
Entry Confirmation with Candlestick Patterns:
Once the price enters the box, the script looks for reversal candlestick patterns:
In a Demand Zone (Green Box): It looks for bullish patterns like the Hammer, Bullish Engulfing, Bullish Harami, and Morning Star. Upon detection, a BUY label appears on the chart.
In a Supply Zone (Red Box): It looks for bearish patterns like the Hanging Man, Shooting Star, Bearish Engulfing, Bearish Harami, and Evening Star. Upon detection, a SELL label appears.
Breakout Signal:
In addition to reversal signals, if the price breaks the White Box (Long Bar Zone) in the opposite direction, a breakout signal is generated, which could indicate a trend continuation.
Visual Elements on the Chart
Green/Red Boxes: The primary Supply and Demand zones from higher timeframes.
White Boxes: The range of the Long Bar candle that activated the primary zone.
BUY/SELL Labels: Trade signals that appear after a candlestick confirmation within the zones.
Moving Averages (SMA 100 & 200): Included to help identify the overall market trend. Trades aligned with the trend are generally more reliable.
Input Settings
period ATR & Bar multiplayer: Allow you to customize the definition of a "Long Bar" based on market volatility.
Number of candle for long bar avrage: The lookback period for calculating the average candle body size.
multiplayer for tp: A multiplier to calculate the take-profit based on the stop-loss size (Risk-to-Reward ratio).
How to Use This Strategy
Apply the script to your main trading timeframe (e.g., 5-minute or 15-minute).
Wait for a Supply (Red) or Demand (Green) zone to be drawn on your chart.
Be patient and wait for the price to return to this zone.
If a BUY or SELL label appears, consider it a valid entry signal.
Always combine these signals with your own analysis and the overall market context.
Disclaimer: This script is an analytical tool and should not be the sole basis for your trading decisions. Always practice proper risk management and thoroughly backtest its performance before using it in a live account.
Volatility Strategy 01a quantitative volatility strategy (especially effective in trend direction on the 15min chart on the s&p-index)
the strategy is a rule-based setup, which dynamically adapts to the implied volatility structure (vx1!–vx2!)
context-dependent mean reversion strategy based on multiple timeframes in the vix index
a signal is provided under following conditions:
1. the vvix/vix spread has deviated significantly beyond one standard deviation
2. the vix is positioned above or below 3 moving averages on 3 minor timeframes
3. the trade direction is derived from the projected volatility regime, measured via vx1! and vx2! (cboe)

Supply & Demand MTF[E7T]This is not your average supply and demand tool. it’s a powerful, flexible indicator that helps traders spot high-probability opportunities by adapting to real-time market conditions. It uses a smart combination of volatility (ATR), volume, and price action to identify key zones where the market is likely to react. Perfect for scalpers and swing traders alike, this strategy brings together adaptive zone detection, trend bias (pivot line), two-tiered signals (S1 and S2), volume filtering, built-in Fibonacci targets, and even a debug mode for transparency and performance tracking.
KEY FEATURES
1. ADAPTIVE ZONE DETECTION; This feature highlights areas where price is likely to bounce or reversebullish demand zones and bearish supply zones. Instead of using fixed levels, it adjusts based on market volatility.
HOW IT WORKS:
Uses Average True Range (ATR) to measure volatility.
TWO MODES:
Low Volatility Mode: Makes zones tighter for calm markets.
High Volatility Mode: Expands zones during choppy or fast-moving conditions.
Plots red boxes for supply zones and blue for demand zones. Zones extend until broken or naturally expire.
WHY IT MATTERS: Traditional zone indicators often fall short in fast-changing conditions. This one adjusts automatically, helping you stay one step ahead.
EXAMPLE: On a 4H BTCUSD chart, a demand zone will form at a key support level and adjust its size depending on whether the market is quiet or volatile.
2. MARKET BIAS PIVOT LINE; This dynamic line helps you quickly see whether the market is trending up or down so you can trade in the direction of strength.
HOW IT WORKS:
Based on recent swing highs and lows (default: last 4 bars).
Line is green when price is above (bullish), red when below (bearish).
Updates live and can be turned on/off in settings.
WHY IT MATTERS: It’s a built-in trend filter. Use it to avoid fighting the market.
EXAMPLE: If SPY is above a green pivot and enters a demand zone, it’s a solid bullish setup.
3. DUAL ENTRY SIGNALS (S1 and S2) The strategy gives you two signal types depending on your risk style:
S1 SIGNALS: Early entry, based on basic confirmation (like a bullish engulfing pattern).
S2 SIGNALS: Stronger entry, requiring solid candle confirmation, volume spike, and close near the zone.
HOW IT WORKS:
S1 = good for aggressive traders or small size entries.
S2 = better for high-conviction trades and bigger position sizes.
Both signals follow your selected market mood (bullish or bearish).
WHY IT MATTERS: Flexibility! Most indicators only offer one signal style. This one gives you choice.
EXAMPLE: In EURUSD, S1 might show up when price taps a demand zone and forms a small bullish candle. If volume increases and the next candle closes strong, S2 confirms the entry.
4. VOLUME CONFIRMATION This filters out weak signals by checking for real buying/selling interest.
HOW IT WORKS:
Compares current volume to previous bar and a 10–14 bar average.
Adjustable volume thresholds for S1 and S2.
Can be disabled for markets with unreliable volume (like certain forex pairs).
WHY IT MATTERS: It adds a layer of quality control. High-volume moves usually mean higher conviction.
EXAMPLE: On AAPL, an S2 will only trigger if volume jumps by 1.3x the average, signaling strong seller presence.
5. BUILT-IN FIBONACCI TARGETS (TP1, TP2, SL) No more guessing exits. The strategy draws take profit (TP) and stop loss (SL) levels automatically based on zone size.
HOW IT WORKS:
TP1 = 2.12x the zone height
TP2 = 3.3x the zone height
SL = 1x the zone height (all adjustable)
These are shown as dashed (TP) and solid (SL) lines with labels
WHY IT MATTERS: Reduces emotional decision-making. Helps you plan trades with consistent risk/reward.
Example: In GOLD, if the demand zone is $20 tall, TP1 would be ~$42.40 higher, TP2 ~$66 higher, and SL $20 lower.
6. FULLY CUSTOMIZABLE INPUTS Tweak the settings to match your style and asset type.
KEY INPUTS:
Market Mood: Choose bullish (1) or bearish (2)
Timeframe Filter: Focus only on reliable zones (30M or 4H) or can disable to show on every timeframe
Zone Limit: Limit how many zones show (e.g., max 4)
Breakout Buffer: Defines how much price must move to break a zone
Zone Opacity: Make zones more/less visible
WHY IT MATTERS: This lets you dial in the indicator for scalping, swing trading, crypto, stocks, or forex.
Example: A scalper might use tighter zones and a low breakout buffer, while a swing trader prefers more zones and higher volatility mode.
7. DEBUG MODE (Optional) Get under the hood and see exactly how the strategy works.
HOW IT WORKS:
Shows metrics like ATR, volatility mode, memory usage, signal win rate, etc.
Plots visual lines showing zone age and success rate (TP1 hit tracking)
WHY IT MATTERS: Very few indicators show their math. This one does—great for power users who want to optimize.
EXAMPLE: You might discover that signals perform best in high volatility mode during news events, helping you adjust settings accordingly.
HOW TO USE IT
1. Add it to your TradingView chart (30M or 4H timeframes recommended).
2. Adjust inputs:
Market Mood = 1 (bullish) or 2 (bearish)
Pick your Volatility Mode
Set Zone Collector Limit (3–4 works well)
Use Timeframe Filter for better signals
3. Watch for S1 and S2:
S1 = quicker trades, lighter risk
S2 = stronger confirmation, bigger trades
4. Use the Pivot Line for trade direction.
5. Manage exits with auto TP/SL levels.
6. Turn on Debug Mode if you want detailed stats.
WORKS VERY WELL WITHOUT REPAINTING
Why It’s a Game-Changer; IT takes the guesswork out of zone trading. It’s not just smart—it’s adaptive. From volatility and volume to dynamic signals and exit plans, everything adjusts based on what the market is doing. And with a built-in trend filter and real-time debug info, it’s like having a trading co-pilot that’s always alert.
Why It’s Different Most zone indicators are basic. This one isn’t. Here’s why:
Adaptive zones that change with the market
Dual signal system (S1/S2) for flexibility
Volume confirmation to filter noise
Built-in Fibonacci targets for clean exits
Debug mode that shows you how it works
YOU CAN SET ALERTS WITHOUT repainting
THIS isn’t just another tool—it’s a smarter, more responsive way to trade.
